
• Google ads 2026
Google Ads was judged to be a bad job, first of all to distinguish the type of advertising and the marketing tasks. This baseline map can help to create a sense of direction, but it cannot be a substitute for account data and real business results.
Reader alert: The following range is not an official Google global harmonization benchmark and does not constitute an impact commitment. Please judge in relation to the industry, country, product, audience and funnel phase.
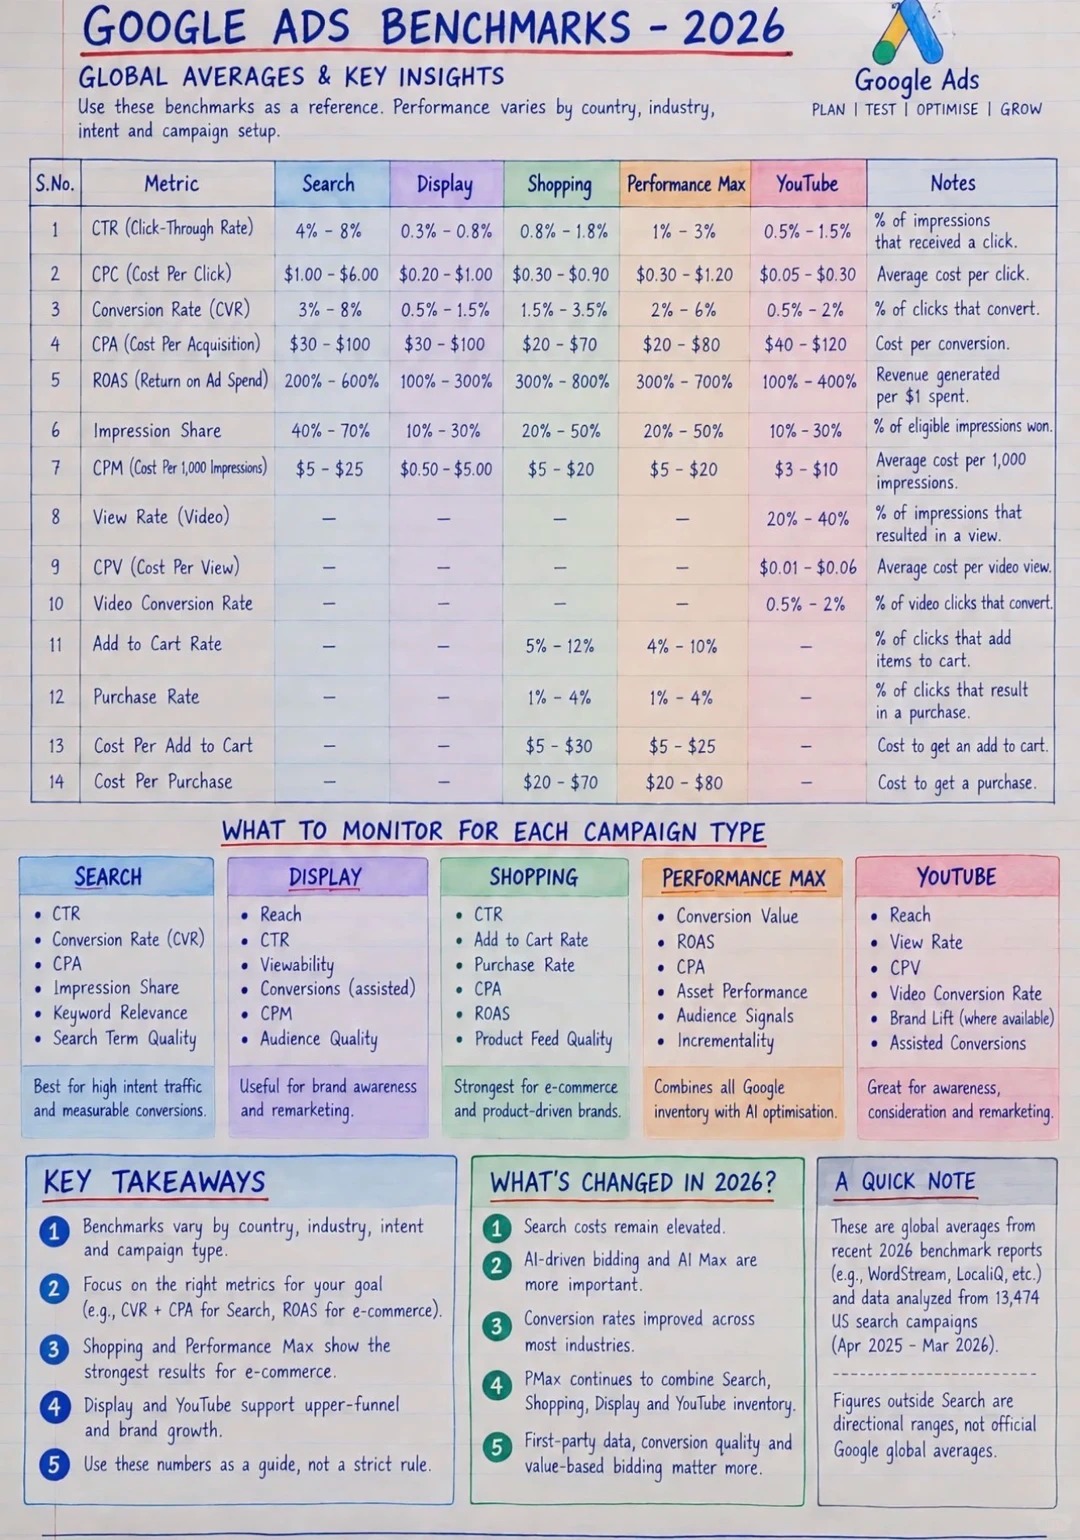
Don't judge all Campaign with the same indicator.
One of the easiest pits for Google Ads is to judge all advertising series against the same indicator. The tasks of Search, Shoping, Pax and YouTube are different, and CTR cannot be compared together.
Ask yourself: What is this Campaign responsible for? Is it a proactive search demand, a procurement drive, or is it a brand recognition? Only when the target, the market and the statistical calibration are similar can the comparison be meaningful.
2026 Google Ads Directional Benchmark
The following figures are derived from the contributions and the graphs at cost in United States dollars. They are directional references, not the official Google global unified benchmark, nor are the performance or effectiveness commitments of the clients present at the site. “-” in the table indicates that the contribution was not included and does not imply that the indicator is not applicable.
| Type of advertisement | CTR | CPC | CVR | CPA | ROAS |
|---|---|---|---|---|---|
| Search | 4%–8% | $1–$6 | 3%–8% | $30–$100 | 2-6 times. |
| Shoping Shopping | 0.8%–1.8% | $0.30–$0.90 | 1.5%–3.5% | — | 3-8 times. |
| Performance Max | 1%–3% | — | 2%–6% | $20–$80 | 3-7 times. |
| YouTube Video | 0.5%–1.5% | — | 0.5%–2% | — | — |
YouTube can also be consulted: 20 per cent - 40 per cent, CPV (per visit cost) 0.01 per cent - 0.06 per visit I'm sorry. The video format is different from the viewing definition and the calibre is confirmed before comparison.
The map also includes expanded indicators such as displaying advertisements, but does not provide original research links, sample grouping and calculation methods sufficient to review the full range. Please do not consider the “global average” in the chart as a direct validated conclusion.
CTR, CVR, CA and ROAS first.
- CTR: The number of hits is displayed to reflect the ability of the advertisement to attract hits, which is not equal to profitability.
- CVR: The number of conversions can be factored into the number of conversions of advertising interactions. The interaction between the different advertising formats is not necessarily a matter of clicking; Conversion actions and counting also affect results.
- CPA: Number of cost conversions. Forms, Qualified Information Notes, and Orders are different conversions and cannot be directly compared with costs.
- ROAS: The conversion value is three times as high as the cost of advertising. If converted value uses sales income, it is still not a profit after the cost of goods, logistics and operations.
Compared before UTM, date range, attribution settings, conversion actions and value calibres. The industry, the country, the product, the audience and the funnel phase all make significant differences.
Every Campaign has its own focus.
| Type | What's your priority? |
|---|---|
| Search | CVR+CPA; Combining search terminological intent with valid query quality. |
| Shopping | Purchase rate + ROAS; Combining the quality of commodity data with the value of real orders. |
| PMax | Conversion value, return and incremental effect. |
| YouTube | Watches + Brand Lift + Assisted Conversion, i.e., brand promotion and supporting conversion contributions. |
A YouTube series CTR is low and not necessarily a failure; A Search series of CTRs of 7 per cent is not too significant if it does not bring about effective transformation.
Incremental effects are not synonymous with the conversion of the platform ' s attribution and will normally require experimentation or other appropriate measurement methods; Not all accounts can be used for brand-up research. When these indicators are not available, no hit rate is used to impersonate brand or incremental effects.
Less than Benchmark, check first and then conclude.
I'm not going to optimise the ad right now because a number is below Benchmark. The mission, data quality and observation cycle of Campaign is checked before the issue is judged to be real.
- Target confirmation: sales, valid information boards or brand touch?
- Check tracking: is conversion double counting, is the value of the order accurate and the form valid?
- Selection of comparable ranges: Consider sample volume, conversion delay, promotion and seasonal change.
- Compare their history with their operational objectives and then use external inter-temporal support for judgement.
- The costs, conversion volumes, conversion values and actual business feedback before and after the adjustment are recorded to avoid a CTR-only decision on success or failure.
What really matters is whether or not it brings about a valuable transformation.
Google advertising for 2026, AI bid, first-party data and Value-based Bidding deserve continued attention. However, automation is not a substitute for real business objectives and accurate conversion data.
The real question is, "Did my CTR reach industry average? “and it is: "Does the money I spend bring a real transformation? I don't think so.
I hope this piece will help you to stay out of your way. Your recognition is the driving force behind my continued sharing and creativity.
Keep reading. Google Ads takes his own course., or understand Google Advertisement Service I'm sorry. Pay advertising performance and Google SEO natural ranking. It was a different goal and should not be confused.
Data boundary and official definition reference
Source of numerical ranges: 2026 base maps and article text provided by users; Their statistical sources are not independently validated. The following official Google information is used only to explain the indicators and the measurement methods and is not endorsed between numerical ranges in the table.